Participation
Submission Guidelines for the EAAMO Social Hackathon #
We invite you to submit your innovative solutions to the EAAMO Social Hackathon. Please follow the guidelines below to ensure your submission is complete and meets the expectations of the hackathon.
- Project Description:
- System Overview: Provide a comprehensive description of your system, including its main features, functionalities, and user interface.
- Usage Instructions: Include detailed instructions for using the system, such as installation steps, user guides, and any necessary configurations.
- Problem Statement:
- Identification of the Problem: Clearly define the specific problem your system seeks to address, highlighting its relevance to the challenge of breast cancer and environmental contaminants in Mexico.
- Importance of the Problem: Explain the significance of the problem, including its impact on public health, social disparities, and the urgency for a solution.
- System Details:
- Technical Specifications: Provide technical details about the system architecture, programming languages, frameworks, and tools used in development.
- Prototype/Deployment: Indicate whether your solution is a prototype or a fully deployed system, and describe any deployment processes or requirements.
- Evaluation and Impact:
- Known Limitations: Discuss any known limitations or challenges associated with your system, including potential technical, logistical, or scalability issues.
- Societal and Ethical Considerations: Address the societal and ethical considerations for using your system, particularly in the context of public health and data privacy.
- Impact Assessment: Provide an assessment of the potential impact of your solution on the identified problem, including quantitative and qualitative metrics if available.
- Future Developments:
- Potential for Improvement: Outline potential future developments for your system, including additional features, enhancements, or scalability plans.
- Collaboration and Implementation: Describe how you envision collaborating with policymakers and other stakeholders to refine and implement your solution, ensuring its practical application and sustainability.
- Submission Format:
- Team Information: Include a brief team description (Team Leader, Contact Email, CVs of Team Members, GitHub Link, and Project title), including the names and roles of each team member.
- Main Document: Submit a PDF document that includes all the sections outlined above. The document should be professionally formatted and easy to read.
- Video Presentation: Include a short video presentation (at most ten minutes long) that showcases your system’s functionality.
- Demo/Prototype: If applicable, provide a link to a live demo or a downloadable prototype of your system.
- Supplementary Materials: Include any additional materials that support your submission.
- Submission Process:
- Declare interest: Please declare your interest in participating in the EAAMO Social Hackathon by filling out the form.
- Data: Data is available at the OpenSouth platform. For the initial analysis of the data, we recommend you to look at the following GitHub repository.
- Submission Portal: Once you finish with you project, submit your documents and materials through the EAAMO Social Hackathon submission form.
- Deadline: Ensure your submission is completed by October 2nd, 2024 (Anywhere on Earth).
- Winner Announcement: The winners will be announced on October 4th, 2024 (Anywhere on Earth).
We look forward to receiving your submissions and seeing how your innovative solutions can drive equity and access in addressing breast cancer and environmental contaminants in Mexico. For any questions or further information, please contact us on membership@eaamo.org.
How to Register #
- Fill out the registration form with your details. Please note that the maximum team size is eight, while the minimum team size is one. Ideally, we would like to have international-multidisciplinary teams.
- Form or join a team, or register as an individual.
- Work on your project.
- Submit your project by October 2nd, 2024 (Anywhere on Earth).
Information about the data and the challenge will be available at the following GitHub link.
Notes:
- The idea must be original, meaningful and complete.
- The solution must be a functional application.
- Contestants can use any technology. In other words, there is no limit to the type of technology and technology stack that teams can use.
- There is no limit to the type of app/system (web, desktop, or mobile app, interactive dashboards, portal, etc.) that teams can design and develop.
- The decision must be legal, it must not contribute to and encourage the commission of misdemeanours and criminal acts.
- The solution must be original and authentic.
- The source code of a solution must be available at GitHub (on any other code sharing platform).
Challenges #
To give you a short glimpse of what we expect, you can look at some of the ideas we propose below. However, feel free to design and develop anything else that you think could help us in our mission to improve breast cancer detection and treatment in Mexico.
- Early Detection: Develop tools and technologies to improve early diagnosis.
- Access to Care: Enhance access to screening and treatment in rural and underserved areas.
- Patient Support: Create platforms or apps to provide support and resources to patients and their families.
- Data Analysis: Utilize data analytics to identify trends and improve treatment outcomes.
As a final note, we want to emphasize that the goal of this hackathon is to foster collaboration and innovation in addressing breast cancer and environmental contaminants in Mexico. We encourage you to think creatively and come up with innovative solutions that can make a real difference in the lives of women in Mexico. Similar efforts have been made in other occasions, where small teams have developed solutions that have had a significant impact on the lives of thousands of people and / or helped people, decision- and policy-makers in day-to-day decision-making. We share some of the publications and tools (might give you some ideas) that have been developed in the past:
- How to get-toilet-paper.com? Provision of Information as a Public Good
- Predicting poverty and wealth from mobile phone metadata
- Internal Migrations prediction and data-informed policy-making in Serbia
- VulnerabilityMap: An Open Framework for Mapping Vulnerability among Urban Disadvantaged Populations in the United States
Who Should Participate? #
We welcome participants from all backgrounds, including:
- Medical professionals and researchers
- Data scientists and machine learning experts
- Software developers and engineers
- UX/UI designers
- Healthcare advocates and policy makers
- Students and educators
Why Participate? #
- Collaborate: Work with passionate individuals from diverse fields.
- Innovate: Develop cutting-edge solutions for real-world problems.
- Network: Connect with experts, mentors, and industry leaders.
- Win Prizes: Gain recognition and support for your innovative ideas.
- Make an Impact: Improve the lives of thousands of women across Mexico.
Jury #
- Dr. José Luis Morán López. Coordinador académico del Centro Nacional de Supercómputo y del Grupo de Ciencia e Ingeniería Computacionales del IPICYT.
- Dr. Daniel Acosta Díaz de León. Coordinador Estatal del IMSS-Bienestar San Luis Potosí
- Dra. Jacqueline Calderón. Autonomous University of San Luis Potosí and visiting professor at Boston College
- PhD Bryan Wilder, Assistant Professor in the Machine Learning Department at Carnegie Mellon University
- Maestra Jessica Albarrán Ramírez
Visualizations #
Just to give you a glimpse of the what is available within the data, please observe the following visualizations and their interpretations.
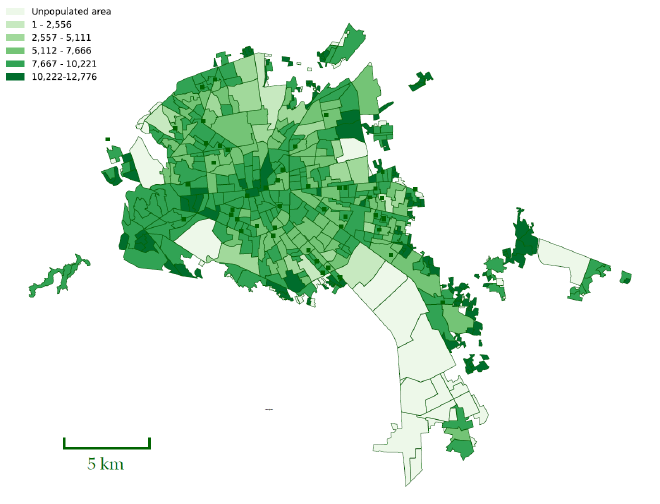
The map of San Luis Potosi in Mexico displays the population distribution across various regions within the city. The regions are color-coded to represent different population densities:
- Light Green (1 - 2,556): Areas with the lowest population density.
- Moderate Green (2,557 - 5,111): Regions with moderate population density.
- Medium Green (5,112 - 7,666): Areas with higher population density.
- Dark Green (7,667 - 10,221): Regions with very high population density.
- Deep Green (10,222 - 12,776): Areas with the highest population density.
- White: Unpopulated areas.

As one can observe, the central parts of San Luis Potosi have higher population densities, as seen by the darker shades of green, suggesting more urbanization and residential concentration. Peripheral areas exhibit a mix of moderate to low population densities, with some unpopulated regions.
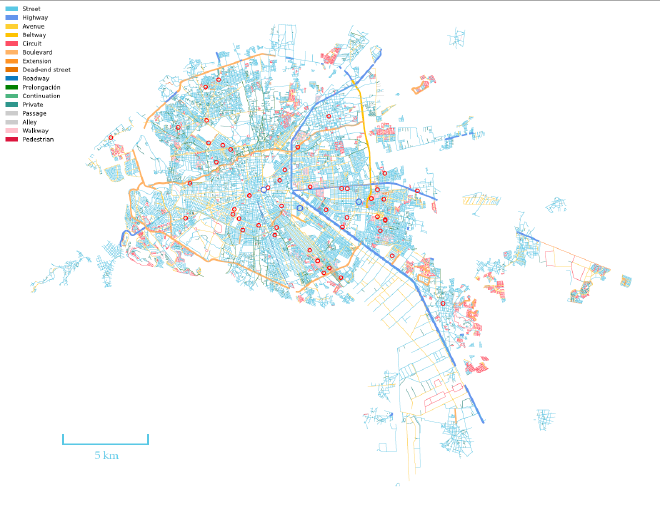
In addition to the population map, one can also create a layout of streets and the distribution of schools across the city. The roads are color-coded to differentiate between various types, and schools are marked with red circles.

The central part of San Luis Potosi has a dense network of streets, avenues, and other road types, indicating a well-developed urban infrastructure. Not surprisingly, the outskirts have fewer roads, with more beltways and extensions, suggesting less urbanization. Access to education is more-or-less well distributed with schools dispersed throughout the city. A higher concentration is in central areas, ensuring accessibility for most residents.
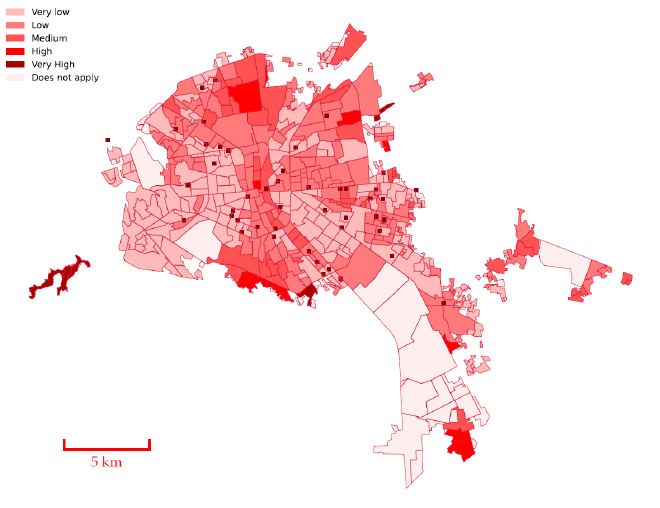
Another interesting data source is marginalization index. The marginalization index is a composite measure that evaluates the degree of exclusion or deprivation experienced by individuals or groups within a specific area, considering factors such as economic, social, and living conditions. It helps identify regions with higher levels of marginalization, guiding policy interventions and resource allocation to improve living standards and reduce inequality.

Areas are color-coded to represent varying levels of marginalization: very low (light pink), low (light red), medium (red), high (dark red), and very high (deep red). The central and some peripheral regions exhibit higher levels of marginalization, indicating significant exclusion and deprivation, whereas other parts of the city show lower levels of marginalization. This visualization might help in solving some of the tasks of this hackathon by identifying the most marginalized areas that require targeted interventions to improve living conditions and social inclusion.
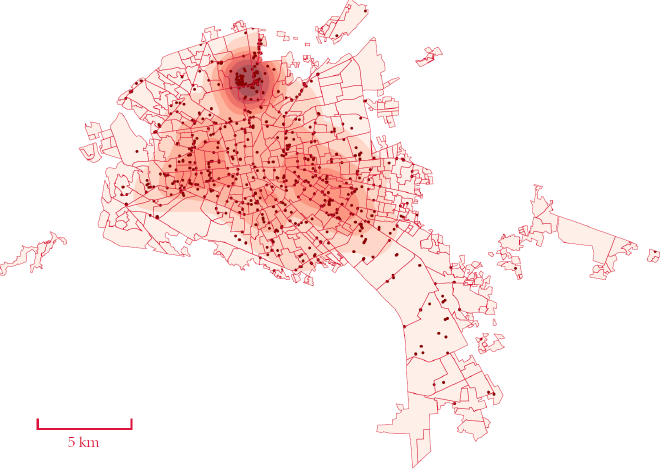
Finally, one can see the polution index and polution sources. In other words, one can observe the level of pollutants in the environment, indicating areas with poor air quality or high contamination. Pollution sources, such as factories, traffic, and waste sites, contribute to higher pollution levels, affecting public health and the environment.

The map of San Luis Potosi, Mexico, shows the distribution of pollution levels and sources within the city. Areas with darker red shades indicate higher pollution levels, particularly concentrated in the northern and central parts of the city. Black dots represent stationary pollution sources, such as industrial sites, which are densely clustered in these high-pollution areas, highlighting the significant impact of industrial activity on air quality in these regions.